  |
|
|
APPENDIX H
The
Business Cycle --
Did Overinvestments Destabilize the National Economy?
This Appendix addresses a
very difficult question: did overinvestments in commercial real
estate destabilize the National economy? The Charts provide powerful
evidence corroborating a substantial financial deterioration, following each
overinvestment episode during the period from 1976 through 1994. The following
economic variables have exhibited substantial or significant deteriorations:
- Total net lending per capita
(all government levels).
- Consolidated deficits (all
government levels; total, per capita, and as percent of personal disposable income).
- Interest on the public debt
(total, per capita, and as percent of personal disposable income).
- Consolidated net debt (total
and per capita).
- Net international investment
position with all foreign countries.
- Debt outstanding of persons
and unincorporated business (per capita, in constant dollars; and as percent of personal
disposable income).
Three conclusions are
unavoidable:
- Massive
increases in consolidated government debts and in personal debts betray an indentured population.
- A National economy can be
destabilized if debts deteriorate out-of-control. Debts have deteriorated
out-of-control following the "credit crunch." The evidence corroborates that governments have been borrowing to pay off the interest on the public
debt!
- The
breakup, destruction, or decay of a country is guaranteed in the long run if the following conditions obtain:
- Net
advantages favor systematically Big Government, Big Business, or certain cliques, at
the expense of the citizen.
- The monopolistic
maxims and practices of the marketplace create a destructive, predatory environment.
- The
space-time implicate order of the economy (i.e., the
space-time distribution and structure of money, including bank-money) favors rich usurers and speculators.
|
|
The
Business Cycle1
Did
Overinvestment Cycles Destabilize the National Economy?
The Deterioration in Canada's Total Net Lending Per Capita |
| OVERINVESTMENTS
THE DETERIORATION IN GOVERNMENT NET
LENDING PER FAMILY.
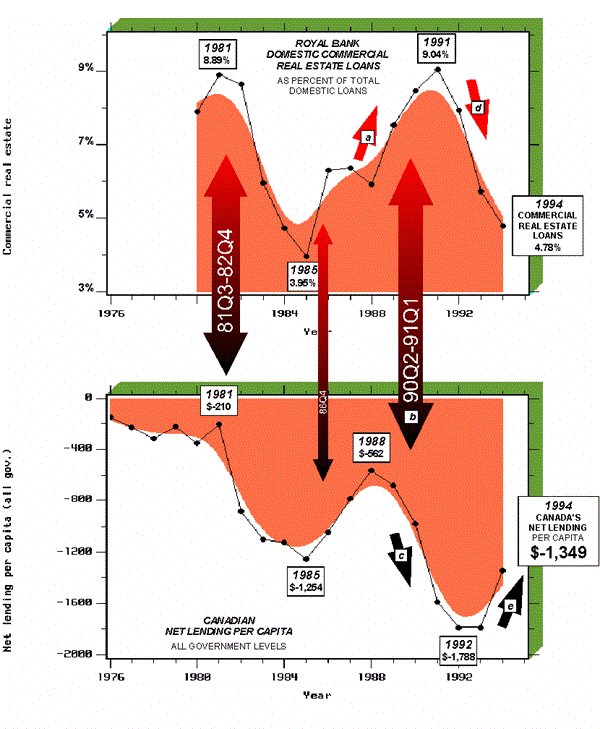
Government net lending (all levels) deteriorated substantially after each of the last two
recessions. For the 1990Q2-1991Q1 recession, government net lending per family
deteriorated from $-1,787 in 1988 to $-5,632 in 1993! |
|
Chart H-1
Did
Overinvestment Cycles Destabilize the National Economy? The Deterioration in Canada's
Total Net Lending Per CapitaOverinvestments in commercial real
estate were followed by substantial increases in net lending by governments. On a
per-capita basis, Canada's net surplus (lending) plummeted from $-210 in 1981 to $-1,254
in 1985, then from $-562 in 1988 to $-1,788 in 1992.
Source: Royal Bank
annual reports (loans by industry, as at September 30); Statistics Canada, Canadian
Economic Observer, Historical Statistical Supplement 1994/1995, Catalogue No. 11-210,
July 1995 (net lending, all government levels, and population); and Statistics Canada, Income
After Tax, Distributions by Size in Canada 1993, Catalogue 13-210, June 1995 (average
family size).
[Copyright © 1998 by
MACROKNOW INC. All rights reserved.]
|
|
The
Business Cycle2
Did
Overinvestments in Commercial Real Estate Strengthen the National Economy?
The Deterioration in Canada's Total Deficit |
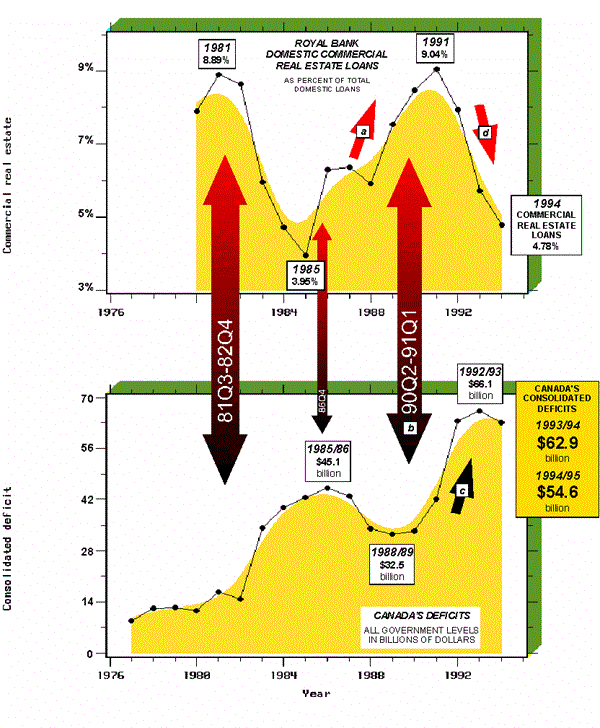 |
Chart H-2
Did
Overinvestments in Commercial Real Estate Strengthen the National Economy? The
Deterioration in Canada's Total DeficitIncreases in commercial real estate
loans (arrow a) were followed by substantial
increases in government deficits (arrow c). (Data for 1992/93 through 1994/95
are estimates.)
Sources: Royal Bank annual
reports (loans by industry, as at September 30); and Statistics Canada, Public Sector
Finance 1995-1996, Financial Management System, Catalogue 68-212-XPB, March 1996
(consolidated government deficits, by fiscal year).
[Copyright © 1998 by
MACROKNOW INC. All rights reserved.]
|
|
The
Business Cycle3
The
Deterioration in Canada's Interest on the Public Debt |
OVERINVESTMENTS
THE LINK BETWEEN
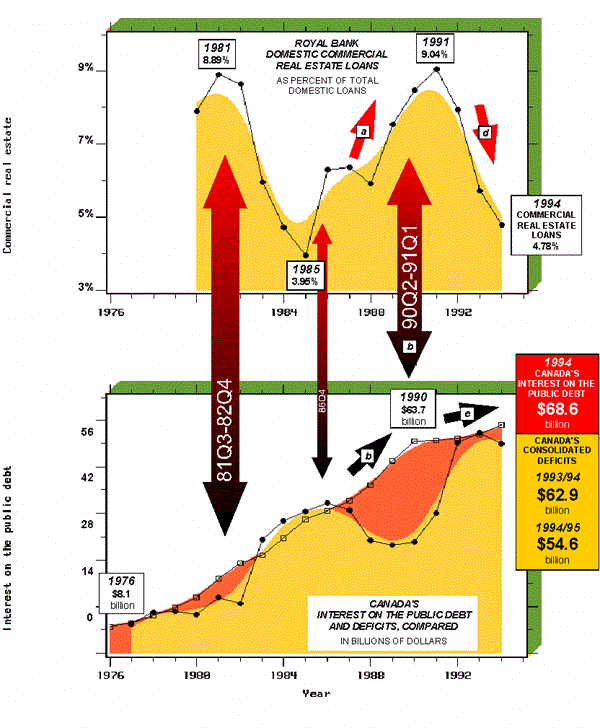
OVERINVESTMENTS, DEFICITS, AND THE INTEREST ON THE PUBLIC DEBT.
The empirical evidence is absolutely clear: governments have been borrowing to pay off the
interest on the public debt. The deficits have accounted for a substantial proportion of
the interest on the public debt. |
|
Chart H-3
Did
Overinvestments in Commercial Real Estate Strengthen the National Economy? The
Deterioration in Canada's Interest on the Public DebtIncreases in commercial real estate
loans (arrow a) were followed by substantial
increases in the interest on the public debt (arrow b). (Data for 1992/93 through 1994/95
are estimates.)
Sources: Royal Bank annual
reports (loans by industry, as at September 30); Statistics Canada, Public Sector
Finance 1995-1996, Financial Management System, Catalogue 68-212-XPB, March 1996
(consolidated government deficit, by fiscal year); and Statistics Canada, Canadian
Economic Observer, Historical Statistical Supplement, 1994/95, Catalogue 11-210, July
1995 (interest on the public debt, all government levels).
[Copyright © 1998 by
MACROKNOW INC. All rights reserved.]
|
|
The
Business Cycle4
The
Deterioration in Canada's Total Net Debt |
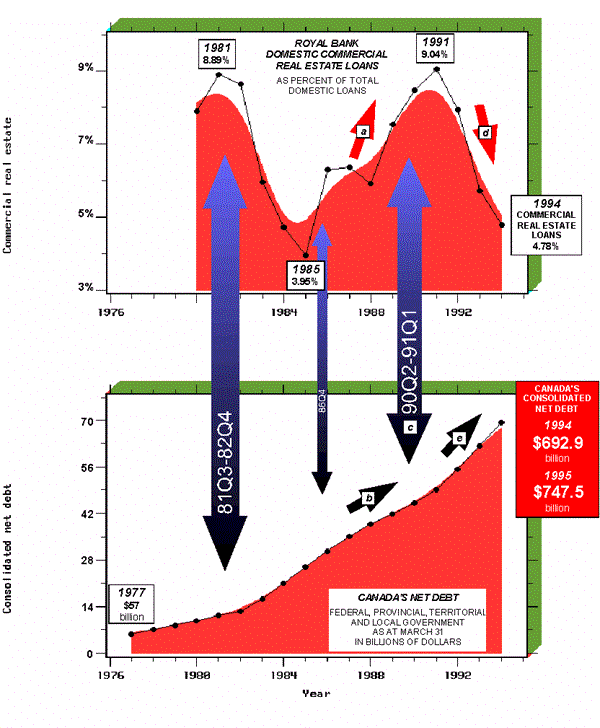 |
Chart H-4
Did
Overinvestments in Commercial Real Estate Strengthen the National Economy? The
Deterioration in Canada's Total Net DebtIncreases in commercial real estate
loans (arrow a) were followed by substantial
increases in government net debt (arrow b). Federal, provincial, territorial
and local government net debt, as at March 31, increased more than twelvefold --
from about $57 billion in 1977 to an estimated $747.5 billion in 1995! (Data for 1994 and
1995 are estimates.)
Sources: Royal Bank annual
reports (loans by industry, as at September 30); Statistics Canada, Public Sector
Finance 1995-1996, Financial Management System, Catalogue 68-212-XPB, March 1996
(consolidated government net debt, as at March 31).
[Copyright © 1998 by
MACROKNOW INC. All rights reserved.]
|
|
The
Business Cycle5
The
Deterioration in Canada's Net International Investment Position |
| OVERINVESTMENTS
DID MONETARY AND BANK POLICIES
STRENGTHEN THE NATIONAL ECONOMY?
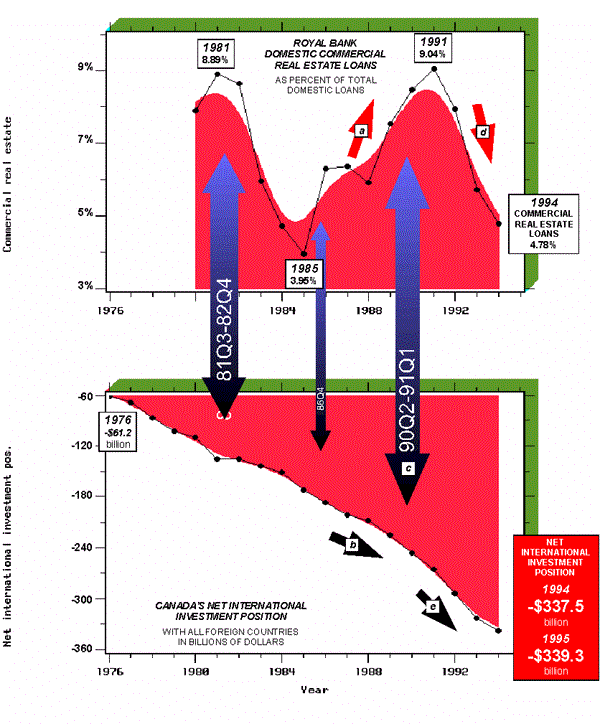
Canada's net international investment position with all foreign countries deteriorated
from -$61.2 billion in 1976 to -$339.3 billion in 1993.
Per-capita debt outstanding of persons and unincorporated businesses soared from $1,995 in
1970 to $17,162 in 1994. Reportedly, the total unfunded liabilities of the Canada and
Québec Pension Plans (CPP and prorated QPP) soared from about $188 billion in 1980 to
about $656 billion in 1993. |
|
Chart H-5
Did
Overinvestments in Commercial Real Estate Strengthen the National Economy? The
Deterioration in Canada's Net International Investment PositionCanada's net international investment
position (total assets less total liabilities) with all foreign countries soared to about
$339.3 billion in 1995!
Sources:
Royal Bank annual reports (loans by industry, as at September 30); P. Martin, Minister of
Finance, The Budget Speech, February 22, 1994 (net public debt); Statistics Canada,
Canada's International Investment Position 1995, Catalogue 67-202-XPB, March 1996
(total assets and total liabilities); and A. Coyne, The Globe and Mail, August 15,
1994, at A9 (Canada's Other National Debt: CPP and prorated QPP unfunded liabilities;
reported data sources: from the Office of the Chief Actuary in Ottawa and from the Fraser
Institute's International Center for the Study of Public Debt).
[Copyright © 1998 by
MACROKNOW INC. All rights reserved.]
|
|
The
Business Cycle6
The
Deterioration in Canada's Interest on the Public Debt Per Capita |
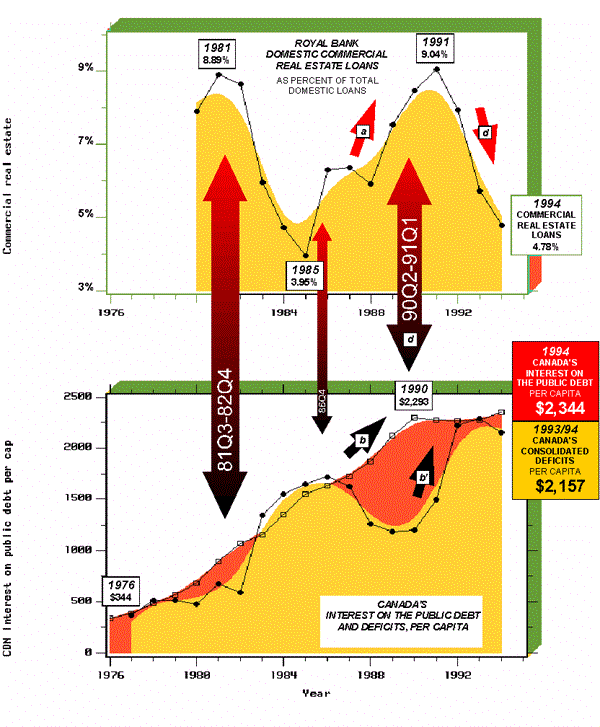 |
Chart H-6
The Deterioration
in Canada's Interest on the Public Debt Per CapitaIncreases in commercial real estate
loans (arrow a) were followed by substantial
increases in per-capita interest on the public debt (arrow b). Per-capita interest on the public
debt increased almost sixfold during 1976-1994 (1992/93 and 1993/94 data are
estimates).
Sources:
Royal Bank annual reports (loans by industry, as at September 30); Statistics Canada, Public
Sector Finance 1995-1996, Financial Management System, Catalogue 68-212-XPB, March
1996 (consolidated government deficits per capita, by fiscal year); and Statistics Canada,
Canadian Economic Observer, Historical Statistical Supplement, 1994/95, Catalogue
11-210, July 1995 (interest on the public debt, all government levels, and population).
[Copyright © 1998 by
MACROKNOW INC. All rights reserved.]
|
|
The
Business Cycle7
The
Deterioration in Canada's Total Net Debt Per Capita |
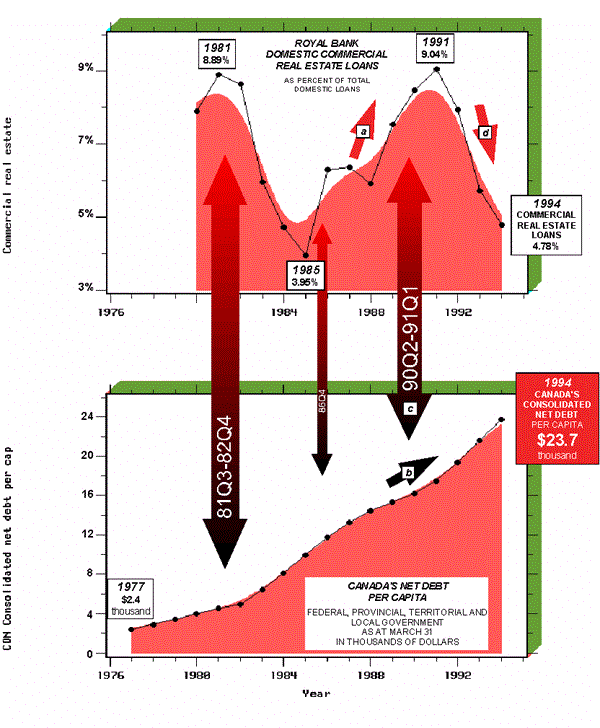 |
Chart H-7
The Deterioration
in Canada's Total Net Debt Per CapitaIncreases in commercial real estate
loans (arrow a) were followed by substantial
increases in per-capita government net debt (arrow b). Per-capita net debt increased
almost ninefold -- from about $2.4 thousand in 1977 to about $23.7 thousand in 1994
(1994 data are estimates).
Sources: Royal Bank annual
reports (loans by industry, as at September 30); Statistics Canada, Public Sector
Finance 1995-1996, Financial Management System, Catalogue 68-212-XPB, March 1996
(consolidated government net debt per capita, by fiscal year); and Statistics Canada, Canadian
Economic Observer, Historical Statistical Supplement, 1994/95, Catalogue 11-210, July
1995 (population).
[Copyright © 1998 by
MACROKNOW INC. All rights reserved.]
|
|
The
Business Cycle8
The
Deterioration in Canada's Government Deficits
and in the Interest on the Public Debt |
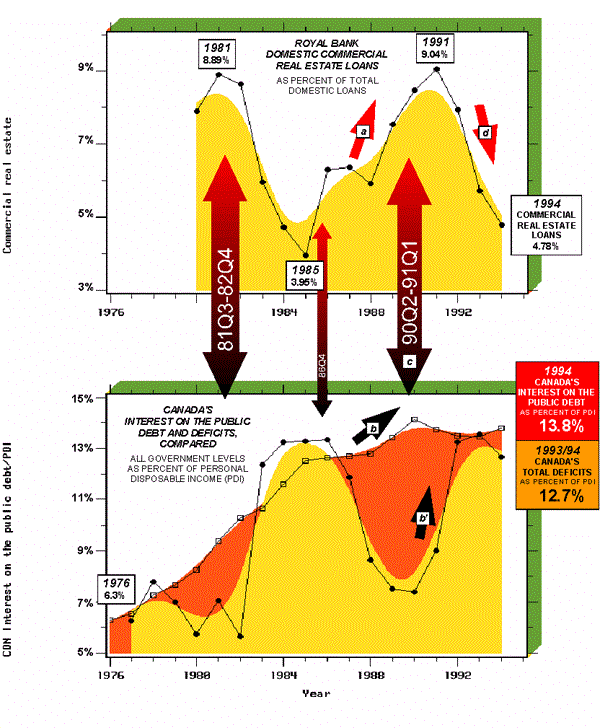 |
Chart H-8
The Deterioration
in Canada's Government Deficits and in the Interest on the Public Debt, as Percent of
Personal Disposable IncomeAs percent of personal disposable
income, Canada's interest on the public debt (all government levels) increased
substantially -- from about 6.3% in 1976 to about 13.8% in 1994.
Sources:
Royal Bank annual reports (loans by industry, as at September 30); Statistics Canada, Public
Sector Finance 1995-1996, Financial Management System, Catalogue 68-212-XPB, March
1996 (consolidated government deficits, by fiscal year); and Statistics Canada, Canadian
Economic Observer, Historical Statistical Supplement, 1994/95, Catalogue 11-210, July
1995 (total interest on the public debt and PDI).
[Copyright © 1998 by
MACROKNOW INC. All rights reserved.]
|
|
The
Business Cycle9
The
Deteriorating Gap Between Canadian Interest
on the Public Debt and U.S. Total Current Interest Paid (NIPA) |
| OVERINVESTMENTS
DID CANADIAN MONETARY AND BANK
POLICIES STRENGTHEN THE NATIONAL ECONOMY?
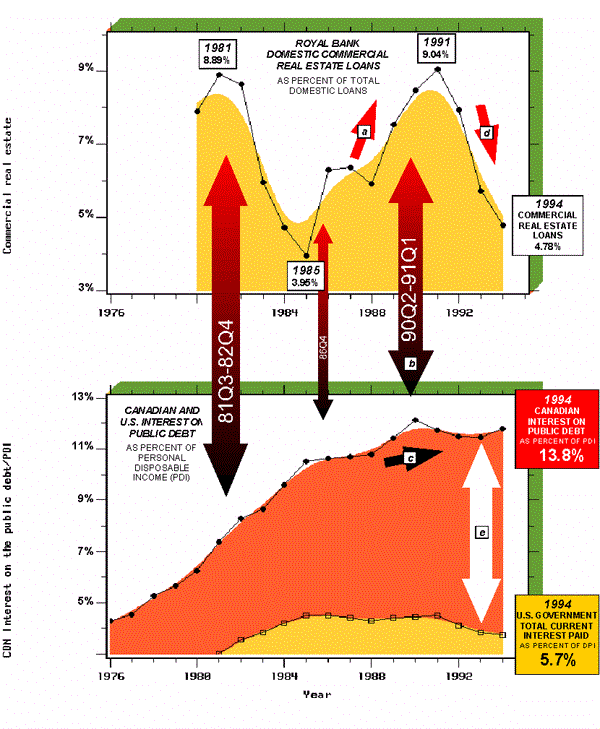
The gap (arrow e) between Canadian interest on the public debt
(all government levels), as percent of personal disposable income, and U.S. Federal and
State and local government current interest paid, as percent of disposable personal
income, widened substantially during the last business cycle. |
|
Chart H-9
Did
Overinvestments in Commercial Real Estate Strengthen the National Economy? The
Deteriorating Gap Between Canadian Interest on the Public Debt and U.S. Total Current
Interest Paid (NIPA), as Percent of Personal Disposable IncomeSources: Royal Bank annual reports
(loans by industry, as at September 30); Statistics Canada, Canadian Economic Observer,
Historical Statistical Supplement, 1994/95, Catalogue 11-210, July 1995 (total
interest on the public debt and personal disposable income (PDI)); and Economic Report of
the President, February 1996 (Department of Commerce, Bureau of Economic Analysis:
disposable personal income (DPI); and Federal and State and local government interest
paid, national income and product accounts (NIPA)).
[Copyright © 1998 by
MACROKNOW INC. All rights reserved.]
|
|
The
Business Cycle10
The
Deteriorating Gap Between Canadian Total Government Net Debt
and U.S. Total Interest-Bearing Public Debt Securities |
| OVERINVESTMENTS
DID CANADIAN MONETARY AND BANK
POLICIES STRENGTHEN THE NATIONAL ECONOMY?
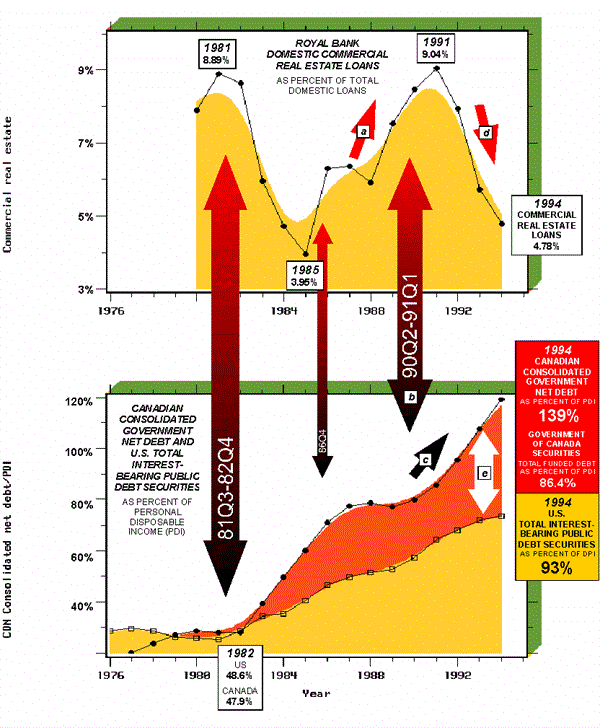
Canada's government debt has become a crushing burden for citizens. As percent of personal
disposable income, Canada's consolidated net debt soared from 47.9% in 1982 to 134% in
1994! Canadians have been clearly indentured to the Money Trust. |
|
Chart
H-10 The Deteriorating
Gap Between Canadian Total Government Net Debt and U.S. Total Interest-Bearing Public Debt
Securities, as Percent of Personal Disposable IncomeSources: Royal Bank annual reports
(loans by industry, as at September 30); Statistics Canada, Public Sector Finance
1995-1996, Financial Management System, Catalogue 68-212-XPB, March 1996 (Federal,
Provincial, Territorial and local government net debt, as at March 31, by fiscal year);
Statistics Canada, Canadian Economic Observer, Historical Statistical Supplement,
1994/95, Catalogue 11-210, July 1995 (government of Canada securities, total funded
debt, and personal disposable income (PDI)); and Economic Report of the President,
February 1996 (Department of Commerce, Bureau of Economic Analysis: disposable personal
income (DPI); and Department of the Treasury: Total interest-bearing public debt
securities, by fiscal year).
[Copyright © 1998 by
MACROKNOW INC. All rights reserved.]
|
|
The
Business Cycle11
Did
Overinvestment Cycles Destabilize the National Economy?
The Deterioration in Personal Disposable Income and Personal Debt, Per Capita |
| OVERINVESTMENTS
DID MONETARY AND BANK LOAN
POLICIES DESTABILIZE THE CANADIAN ECONOMY?
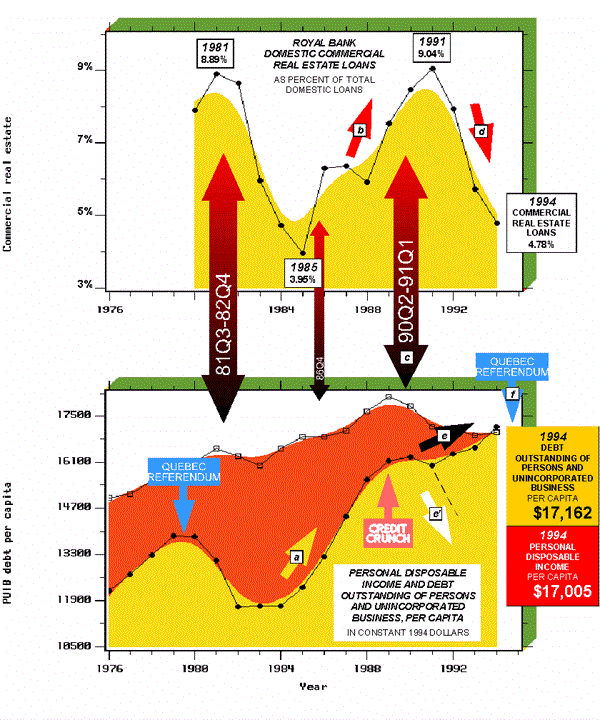
Debt outstanding of persons and unincorporated business per capita deteriorated, from
$11,718 in 1982 to $16,269 in 1990! Instead of improving (arrow e' ), as it did after 1979, the
debt deteriorated out-of-control to a record $17,162 in 1994 (arrow e)! The deterioration followed the onset of the
"credit crunch" at banks, and culminated with the Québec Referendum of
October 1995 (arrow f). 45.8% of Quebecers voted for separation! |
|
Chart
H-11 Did
Overinvestment Cycles Destabilize the National Economy? The Deterioration in Personal
Disposable Income and Personal Debt, Per CapitaOverinvestments in commercial real
estate had a profound impact on the National economy -- and on Canadians. Real
per-capita debt outstanding of persons and unincorporated business deteriorated out-of-control
-- from $11,718 in 1982 to $17,162 in 1994!
Source: Royal Bank annual
reports (loans by industry, as at September 30); Statistics Canada, Canadian Economic
Observer, Historical Statistical Supplement 1994/95, Catalogue 11-210, July
1995 (population); Statistics Canada, National Balance Sheet Accounts, Catalogue
13-214, March 1995, and R. Smith, November 24, 1995 (private communication: debt
outstanding of persons and unincorporated business).
[Copyright © 1998 by
MACROKNOW INC. All rights reserved.]
|
|
The
Business Cycle12
Did
Overinvestment Cycles Destabilize the National Economy?
The Deterioration in Personal Debt, as Percent of Personal Disposable Income |
| OVERINVESTMENTS
DID MONETARY AND BANK LOAN
POLICIES DESTABILIZE THE CANADIAN ECONOMY?
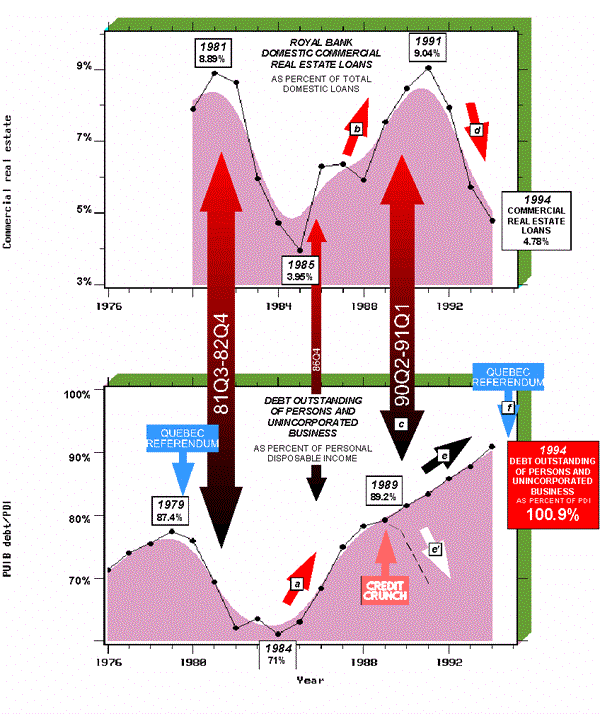
Massive increases in National and personal debts betray a destabilized National economy.
Canada barely survived the last overinvestment cycle. Will it survive the next
exploitation or predation cycle? Bank stability and gargantuan profits must not be at the
expense of National stability. If Big Business indentures
too many too much, Canada, despite its fabulous resources and wealth, will
collapse. |
|
Chart
H-12 Did
Overinvestment Cycles Destabilize the National Economy? The Deterioration in Personal
Debt, as Percent of Personal Disposable IncomeDebt outstanding of persons and
unincorporated business, as percent of personal disposable income, deteriorated out-of-control
after 1989. The debt did not improve (arrow e' ), as it did after 1979; instead it
deteriorated (arrow e) to 100.9% in 1994!
Sources:
Royal Bank annual reports (loans by industry, as at September 30); Statistics Canada, Canadian
Economic Observer, Historical Statistical Supplement 1994/95, Catalogue 11-210, July
1995 (personal disposable income); and Statistics Canada, National Balance Sheet
Accounts, Catalogue 13-214, March 1995, and R. Smith, Nov. 24, 1995 (private
communication: debt outstanding of persons and unincorporated business).
[Copyright © 1998 by
MACROKNOW INC. All rights reserved.]
.JPG) |
A
nation in debt is not a nation of free people.
|
|
|

|


