  |
|
|
|
APPENDIX E
The Business Cycle --
The Implicate Order of the Economy
This Appendix addresses a
very difficult question: what determines the time-evolution pattern of bank-money
(specifically, the timing and scale of the overinvestments in commercial real estate)?
Since the space-time pattern of commercial real estate loans does propagate through the
economy, with potentially devastating consequences (see Appendixes C, D, F, and H), it is
most important to understand how and from whence this pattern originates. The following
Charts display the ordered structural links in the money chain:
- The average family income
after tax, in constant dollars.
- The year-over-year change in
the money stock:
- M2-M1,
- M2, and
- M3.
- The interest rates and the
change in consumer prices:
- the lending rate (prime),
- the T-Bill rate, and
- the consumer inflation rate.
- The GDP per capita, in
constant dollars.
The Charts demonstrate
that the changes in the time-distribution and time-structure of
money enfold the implicate order1 of the
national economic enterprise. One unavoidable conclusion is this: the people who control this implicate order control the economy.
|
|
| 1
For the concepts of enfoldment and implicate order, see David Bohm, Wholeness
and the Implicate Order, 1980. For a more technical presentation, see David Bohm and
Basil J. Hiley, The Undivided Universe, 1993, at 6, 10, and 176-180. For the
concepts grounding in metaphysics, see Martin Heidegger, Nietzsche, translated by
David Farrell Krell, Vol. II: The Eternal Recurrence of the Same, at 116-117 (in The
Character of "Proof" for the Doctrine of Return). |
|
The
Business Cycle1
The
Link Between the Family Income After Tax and Commercial Real Estate Loans |
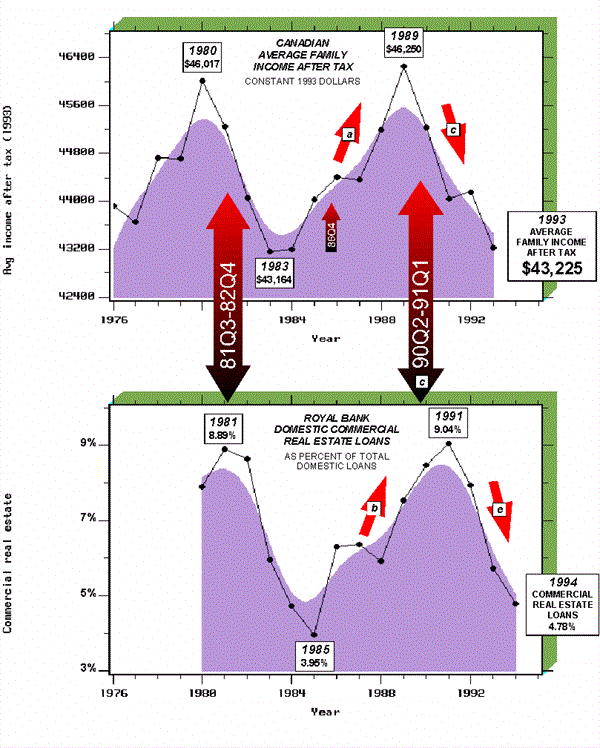 |
Chart E-1
What Drove
Banks to Increase Commercial Real Estate Loans? The Link Between the Average Family Income
After Tax and Royal Bank Commercial Real Estate LoansIncreases in real average family
income after tax (arrow a) preceded increases in commercial
real estate loans (arrow b). Banks continued to channel high
loan percentages into real estate, well after the real family income after tax had started
falling. The mismatch signifies overinvestments. These were followed by a recession
(arrow d), price meltdowns, increases in
bankruptcies, etc.
Sources: Royal Bank
annual reports (loans by industry, as at September 30); and Statistics Canada, Income
After Tax, Distributions by Size in Canada 1993, Catalogue 13-210, June 1995 (average
family income after tax, in constant 1993 dollars).
[Copyright © 1998 by
MACROKNOW INC. All rights reserved.]
|
|
The
Business Cycle2
The
Link Between Changes in the Money Stock (M2-M1)
and Commercial Real Estate Loans |
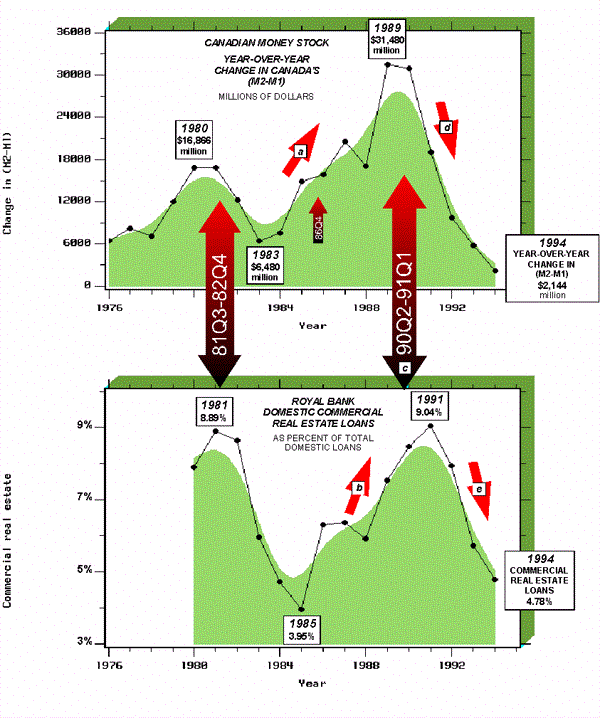 |
Chart E-2
What Drove
Banks to Increase Commercial Real Estate Loans? The Link Between Changes in the Money
Stock (M2-M1) and Royal Bank Commercial Real Estate LoansThe money stock (M2-M1) represents very
liquid assets. Increases in the year-over-year change in (M2-M1) (arrow a) preceded increases in commercial
real estate loans (arrow b). Overinvestments occurred
when financial institutions continued to channel high loan percentages into commercial
real estate, well after the change in money stock (M2-M1) had stopped growing. Money stock
data in millions of dollars.
Sources: Royal Bank
annual reports (loans by industry, as at September 30); and Statistics Canada, Canadian
Economic Observer, Historical Statistical Supplement, 1994/95, Catalogue 11-210, June
1995 (Bank of Canada: monetary aggregates -- M1, M2, and M3).
[Copyright © 1998 by
MACROKNOW INC. All rights reserved.]
|
|
The
Business Cycle3
The
Link Between Changes in the Money Stock and Commercial Real Estate Loans |
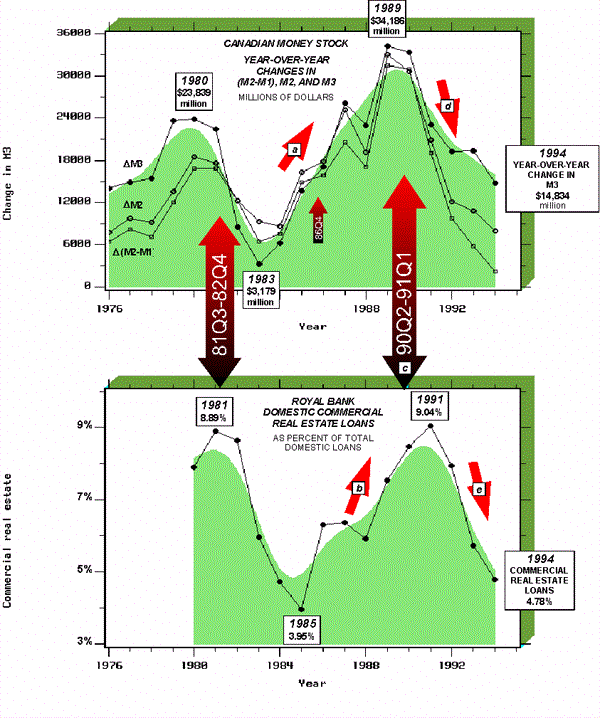 |
Chart E-3
What
Drove Banks to Increase Commercial Real Estate Loans? The Link Between Changes in the
Money Stock and Royal Bank Commercial Real Estate LoansIncreases in year-over-year changes
in the money stock (M2-M1, M2, and M3) (arrow a) were followed by increases in
commercial real estate loans (arrow b). Overinvestments occurred
when financial institutions continued to channel high loan percentages into commercial
real estate, well after the changes in money stock had started falling. A recession
followed (arrow c). Money stock data in millions of
dollars.
Sources: Royal Bank
annual reports (loans by industry, as at September 30); and Statistics Canada, Canadian
Economic Observer, Historical Statistical Supplement, 1994/95, Catalogue 11-210, June
1995 (Bank of Canada: monetary aggregates -- M1, M2, and M3).
[Copyright © 1998 by
MACROKNOW INC. All rights reserved.]
|
|
The
Business Cycle4
The
Link Between the Lending Rate and Commercial Real Estate Loans |
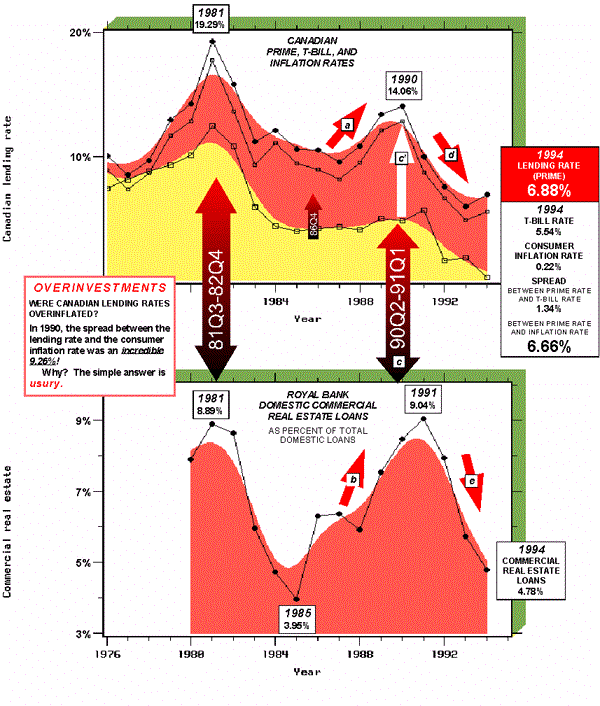 |
Chart E-4
What Drove Banks
to Increase Commercial Real Estate Loans? The Link Between the Lending Rate (Prime) and
Royal Bank Commercial Real Estate LoansIncreases in real average family
income after tax and in the money stock, combined with the opportunity to earn
higher interest incomes from inflated lending rates (arrow c' ),
drove banks to channel proportionally more loans into highly collateralized
commercial real estate.
Sources: Royal Bank
annual reports (loans by industry, as at September 30); Statistics Canada, Canadian
Economic Observer, Historical Statistical Supplement, 1994/95, Catalogue 11-210, June
1995 (CPI deflator); and International Monetary Fund, International Financial
Statistics Yearbook, 1993, and International Financial Statistics, July 1995
(Canadian treasury bill rate 60c and lending rate 60p).
[Copyright © 1998 by
MACROKNOW INC. All rights reserved.]
|
|
The
Business Cycle5
The
Link Between the Gross Domestic Product and Commercial Real Estate Loans |
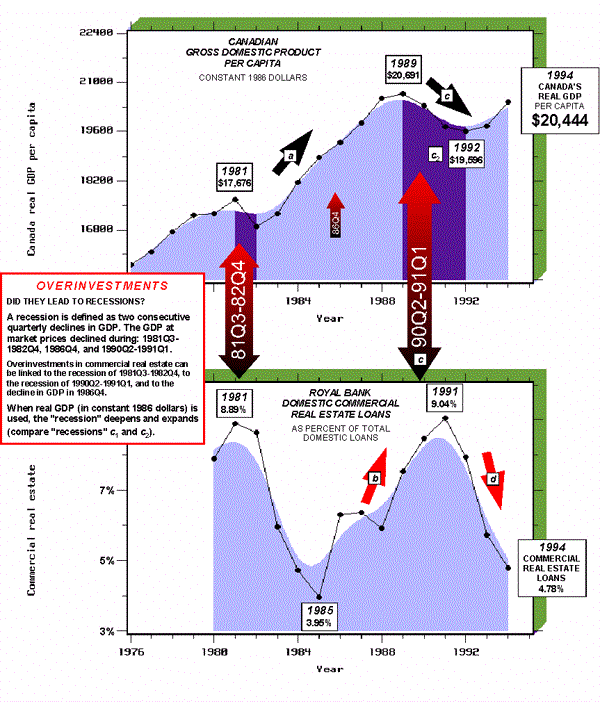 |
Chart E-5
What Drove
Banks to Decrease Commercial Real Estate Loans? The Link Between the Gross Domestic
Product and Royal Bank Commercial Real Estate LoansIncreases in GDP per capita (arrow a) were followed by increases in
commercial real estate loans (arrow b). The economic expansion was
followed by speculative overinvestments; and these led to the decline in the GDP -- or the
recession (arrow c). The recession forced a contraction
in commercial real estate loans (arrow e).
Sources: Royal Bank
annual reports (loans by industry, as at September 30); Statistics Canada, Canadian
Economic Observer, Historical Statistical Supplement, 1994/95, Catalogue No. 11-210,
July 1995 (GDP at 1986 prices and population).
[Copyright © 1998 by
MACROKNOW INC. All rights reserved.]
|
|

|


